The Data x Violence x Women project wants to disprove the false information about sexist violence with open data.
When we talk about male violence , especially in the public sphere and in the media, no conclusion is often reached due to the large amount of false or unverified information that is published. In addition, in recent years, with the rise of the far right and its presence in public institutions, media, social networks, etc. fake news about violence has increased even more.
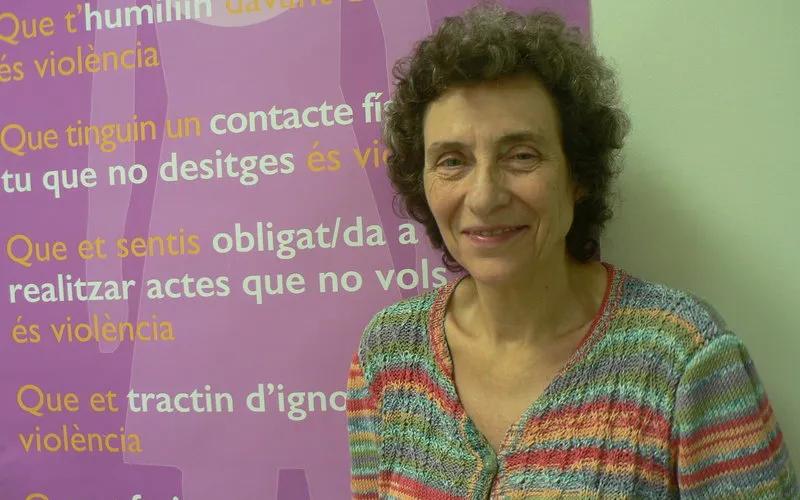
Faced with this boom in empty discourse, the association Iniciativa Barcelona Open Data has launched the Data x Violence x Women portal to answer all of this with data. Almost twenty databases have been used to create the portal, which have been represented in seventeen visualizations . We talked about it with Lourdes Muñoz , director of the Barcelona Open Data Initiative and the Data Woman team.
What is Data x Violence x Women?
This is a project that, at the time, at the end of 2019, we launched with the aim of putting the data on the impact of gender-based violence on the table and contrasting them with the public resources that are intended to support women.
In this way we wanted to address the public debate about whether or not there are really many resources for victims of violence. We then sought data from multiple sources to have an evolving, high-volume view to be able to observe real trends and provide objective data to public opinion.
Male violence is something you already worked on in the organization.
Yes, we were already working on the topics of data technologies and women's rights . We had done some projects, but at a certain point, at that time, the debate that we have already mentioned opened up.
And we saw the value we could bring, not only because of that, but to be able to respond to all these opinions with contrasting data . In other words, we wanted to know how many women are murdered, how many complaints are filed, how many public resources are devoted to these issues, how many have protection orders granted, etc.
What is the Data Woman team that has taken on this project?
Data Woman is a specific team that we have that was created about four years ago. As a team we have specialized in using data technologies and, in particular, open data , to provide valuable information for intervention in the field of women's rights . In addition, we want to build a new perspective, that of data feminism .
In this sense, the team has several goals: on the one hand, we want to search for data and do projects related to violence with open data, we also want to empower women in the digital sector , and, in addition, we seek to generate opinion on how to apply data technologies from the point of view of women's rights. In other words, we want to bring the gender perspective to data technologies and, specifically, to open data.
Speaking again of the portal, with what criteria have you organized all the information it contains?
As the starting point is to try to measure the impact of male violence against women and public resources, the first criterion was to have historical and comparable data between autonomous communities . The data for one year can be circumstantial, that is to say, the budget can be finished in one year, there can be a peak in complaints and other occasional cases.
On the other hand, when you have a twelve-year consistency of data, you can try to see if there is more incidence in one community or another, how the data evolves, and other variables. In this sense, having the history and being able to compare it is very important.
What methodology did you use to collect and process all this data?
The methodology we follow is to ask ourselves questions about a specific topic and then we look for existing open data sources, doing a first search on how this data is disaggregated, since, for example, if we want to compare some indicator at the municipal level or at the regional level, but the existing data have only been collected at the level of the autonomous community or the Spanish state, the comparison cannot be made.
Once we've done that first search, we see what we have and always try to go further, looking for other data that isn't so obvious to fill in those missing pieces.
How is this data visualized on the different portals that are part of Data x Violence x Women?
The portals are designed for four different uses . The first is the most obvious, the most superficial level of data visualization, that is, going to the web and viewing it . In this sense, we always try to present the data in the easiest way possible.
A second level, which would mean taking a step forward in the technical field, would be the option to download the data , which is always available. There is a data repository where we publish all 'datasets' (databases) and classify them.
Another level of the portal, in this case for people interested in the topics, but who may not have as much knowledge in the interpretation of the data, consists of describing the main data below the visualizations , to encourage people to play with them, to investigate more, etc. For example, in this new version of the portal we have included a section called ' Discover the Data ' where we make small video capsules highlighting some data to spread its impact.
And the fourth use, which will be implemented soon, is that all portals will have a part that will incorporate training resources to learn more about data.
What future does the project have now?
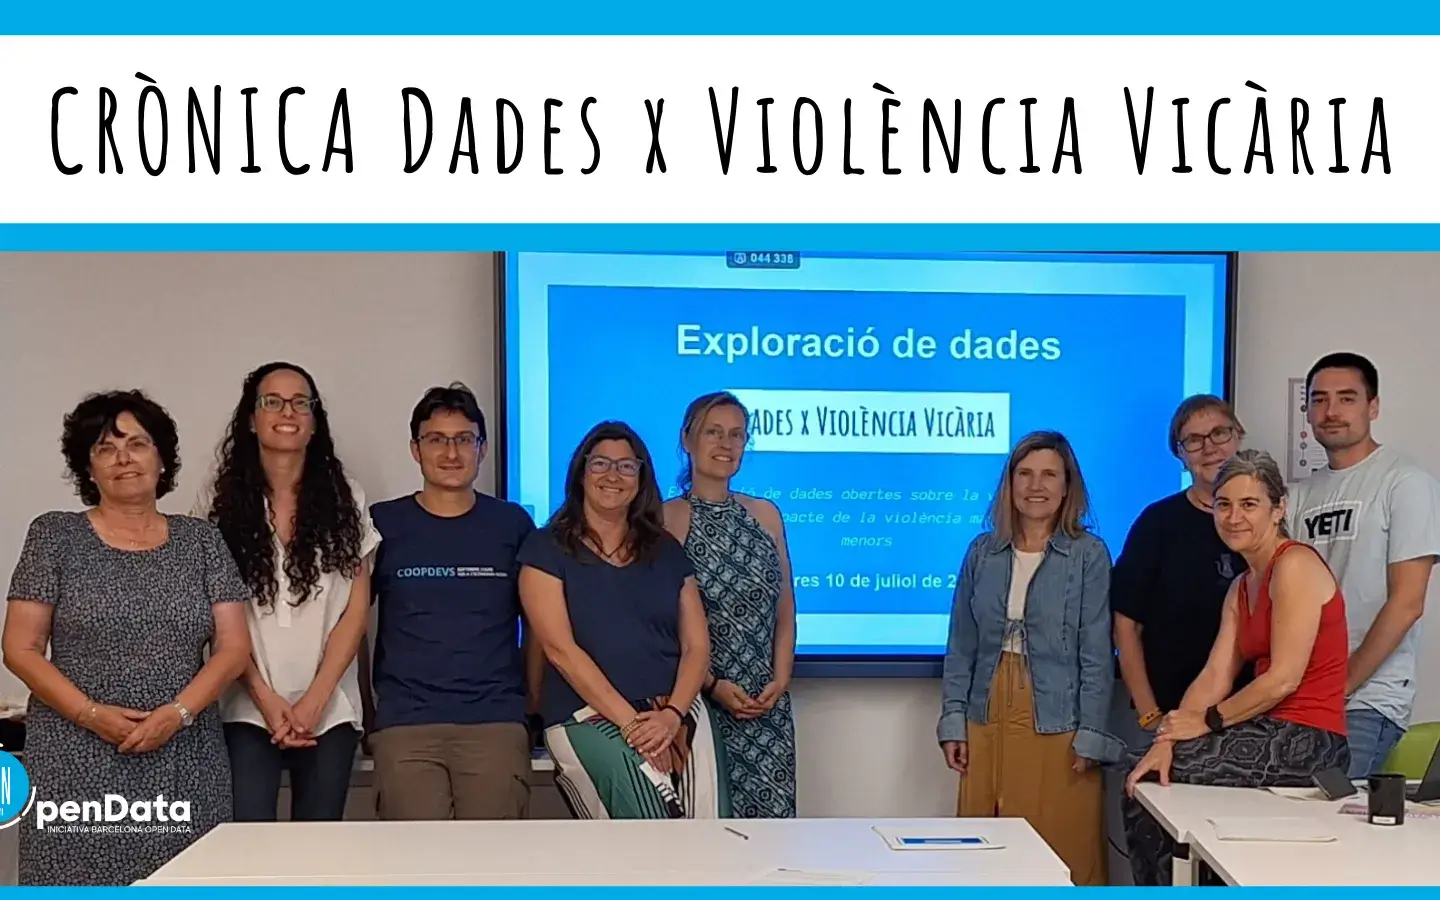
We update the portal data every year, because new ones are coming out. In addition, this year the aim is to expand the data on the impact of male violence on minors, boys and girls, that is to say, to try to see how vicarious violence impacts both as well as the other consequences that violence has on the minors.




Add new comment